
Getting Started
What is Formulavize?
Formulavize is a visual workflow editor for the fiz domain-specific language (DSL). You write fiz recipes in a code editor, and Formulavize compiles them into directed acyclic graphs (DAGs) that get drawn as you type.
The app opens with a default example loaded, and a built-in tutorial teaches the language a puzzle at a time.
Your First Recipe
The simplest fiz program is a single call:
f()

That is a complete recipe: one node, named f. Every call creates a node.
Adding Structure
Use assignments to name a call's node, then pass that name to another call to draw an edge:
a = rinse()
b = dry(a)
c = chop(b)

This is three nodes (rinse, dry, chop) and two edge (rinse → dry → chop). The names a, b, and c are not nodes: an assignment just names the node created by its right-hand side. Edges are drawn to the name's referent node.
An argument always refers to something already bound, so a name has to be assigned before a call can use it.
Referencing a variable more than once fans out from the same node:
butter = fetch()
m = melt(butter)
r = rest(butter)
partial = combine(m, r)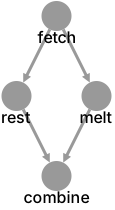
Here fetch feeds both melt and rest, which both feed combine.
Adding Style
Give nodes a visual identity with inline styles. A style block on a call styles the node that call creates:
x = pour()
y = chill(x){ background-color: #80ebff }

Or define a reusable style tag and apply it:
#highlight { background-color: #80ebff; shape: "diamond" }
x = pour()
y = chill(x){ #highlight }

A style block on an assigned name styles the edges that name draws instead:
x = pour()
y{ line-color: "red" } = drip(x)
chill(y) // this edge is red

Note that keyword values are strings (e.g. shape: "diamond", not shape: diamond).
Next Steps
The examples above are just a quick introduction to fiz. The best way to learn fiz is to play through the formulavize tutorial. For more detailed language behaviours, see the following pages:
- Calls & Variables — Calls, arguments, assignments, and variables
- Namespaces — Group statements into nested sub-graphs
- Imports — Pull in external fiz files
- Styling — The complete styling system
- Renderers — Pick a renderer and configure its layout
- About Notes — Attach metadata to a recipe